Pricing Benchmark Report
This premium report highlights how an agent’s listing compares to the competition, with an adjustable filter for “similar properties” that lets the agent determine the comparable market. The report enables the agent to compare the listing’s relative pricing, showing activity, DOM, and more against competing listings, valuable for keeping sellers apprised of their market position during the life of a listing.
Click the image for full size.
To update your services please contact support@showingtime.com or check out the Pricing Benchmark Report page on our website to learn more.
Step 1
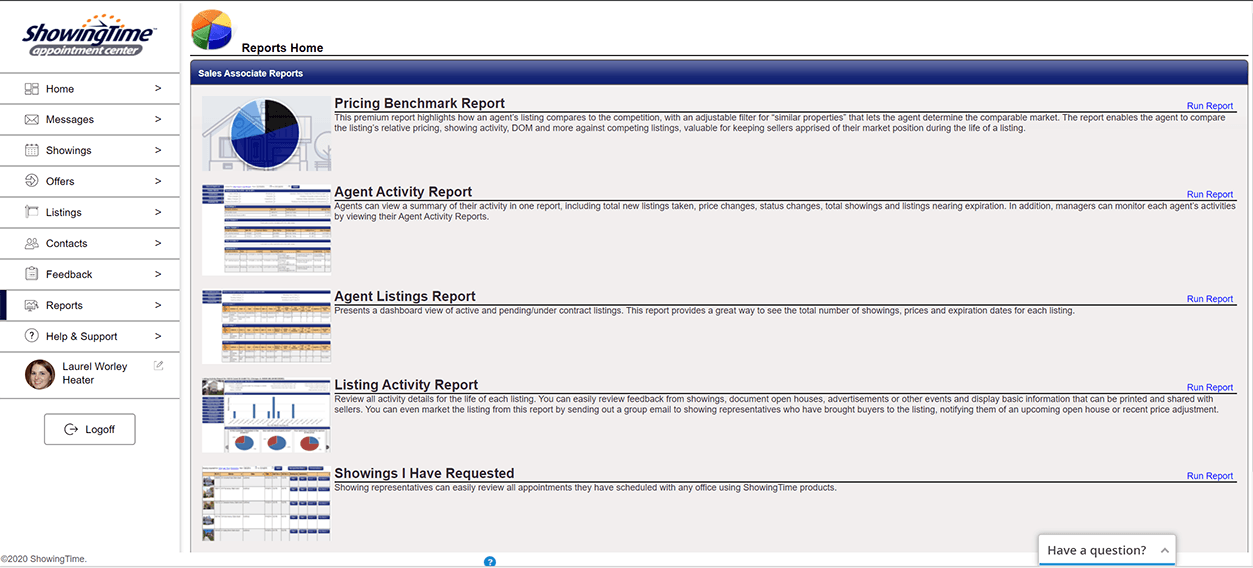
Select Reports from the main menu.
Click the image for full size.
Step 2
Select Pricing Benchmark Report.
Step 3
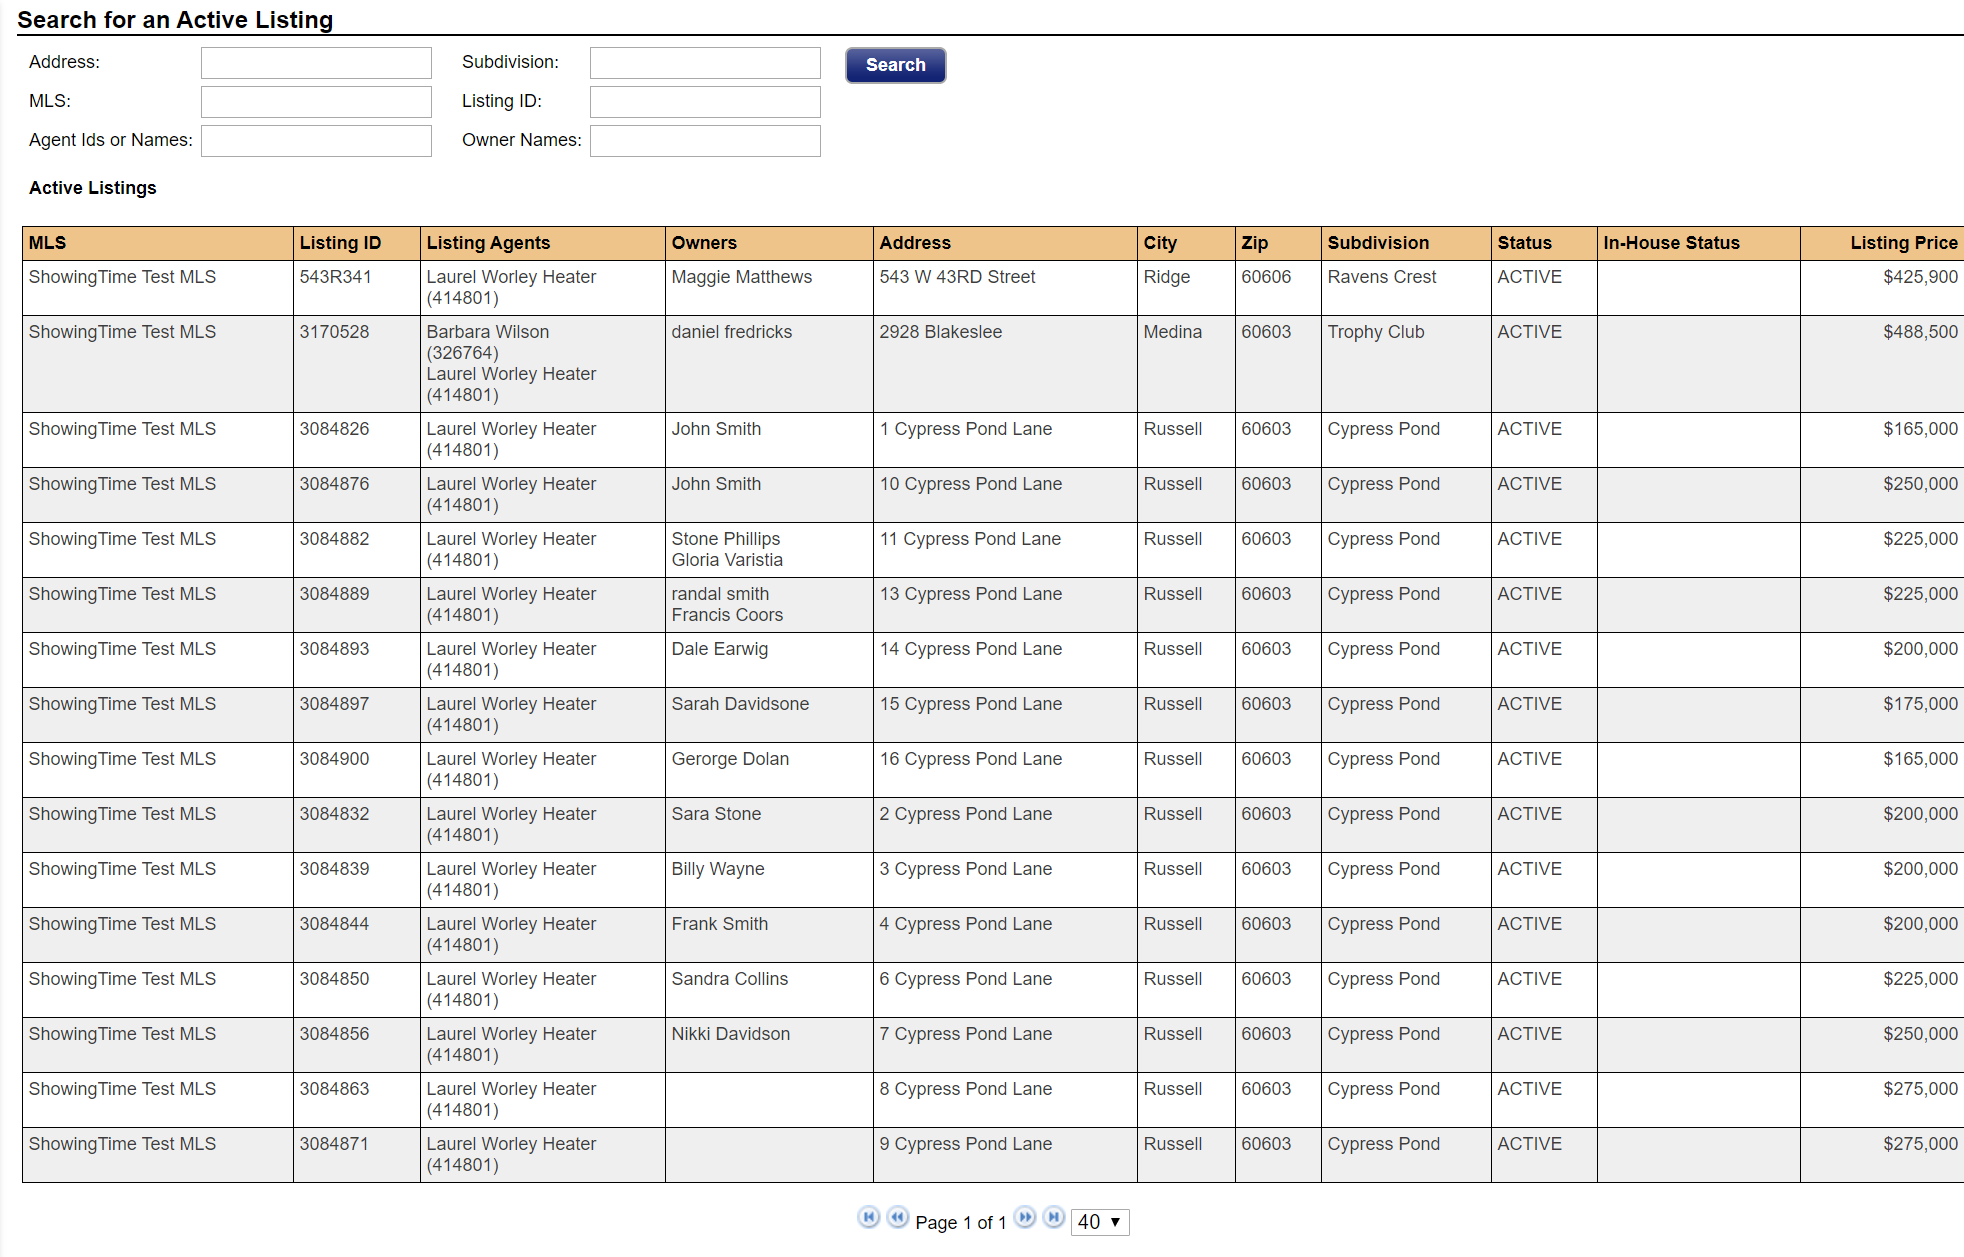
Select the listing.
Click the image for full size.
Step 4
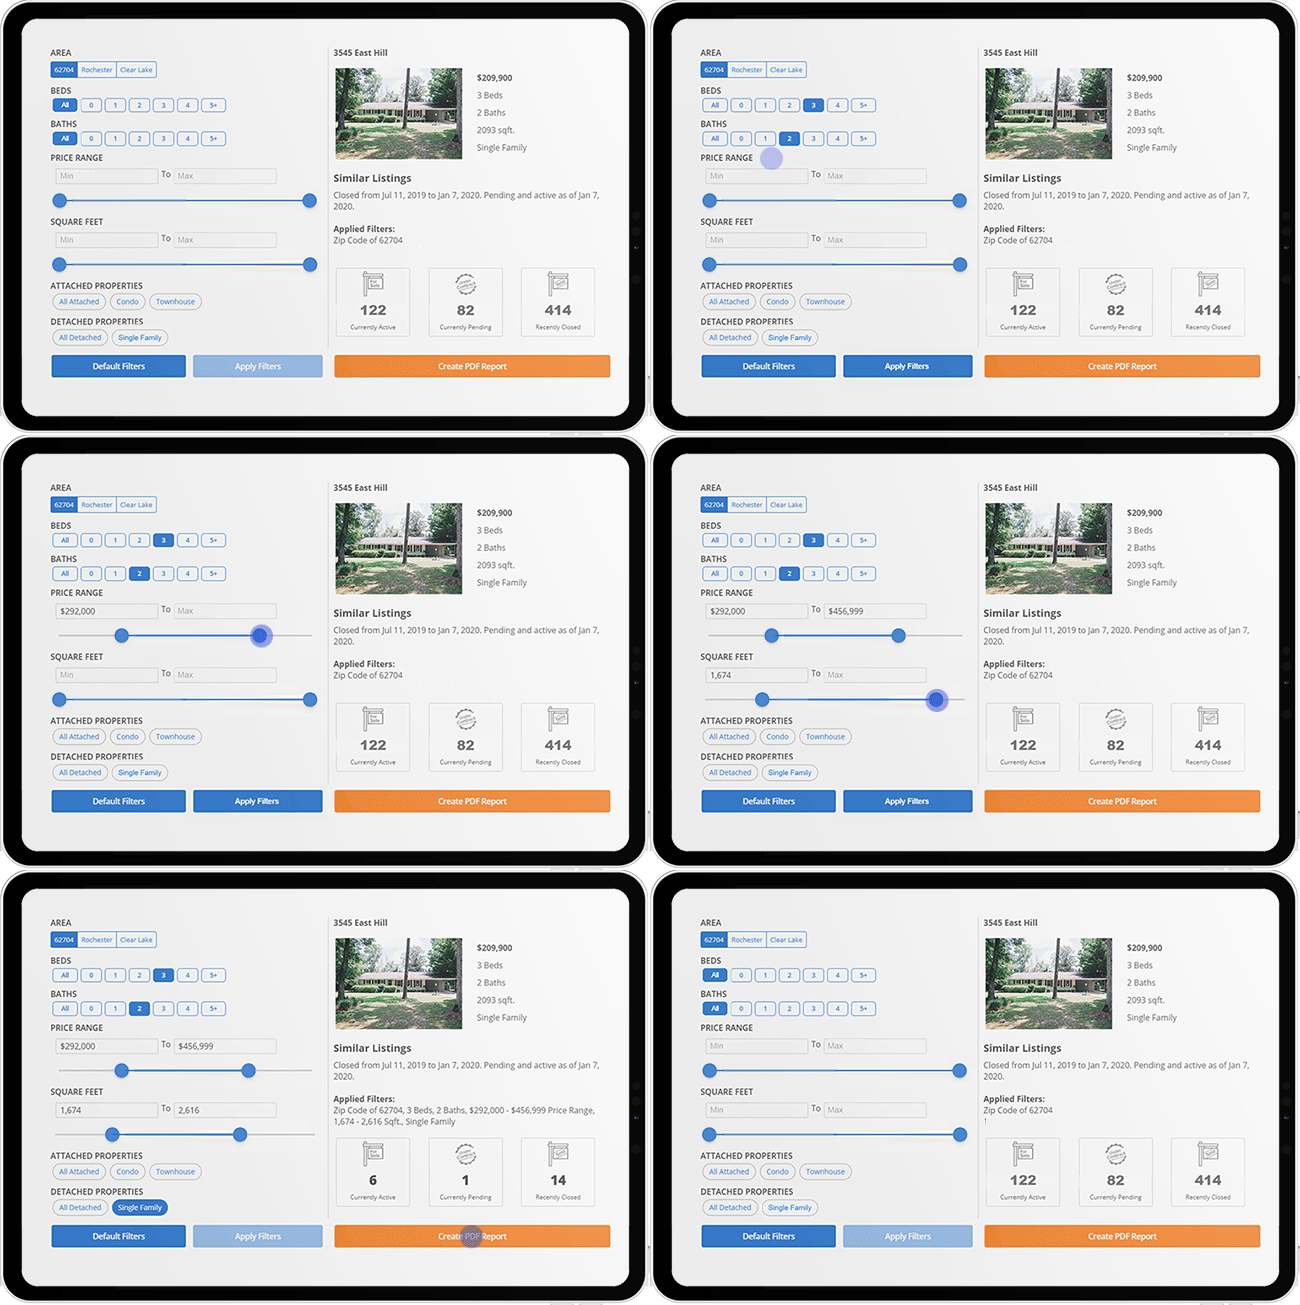
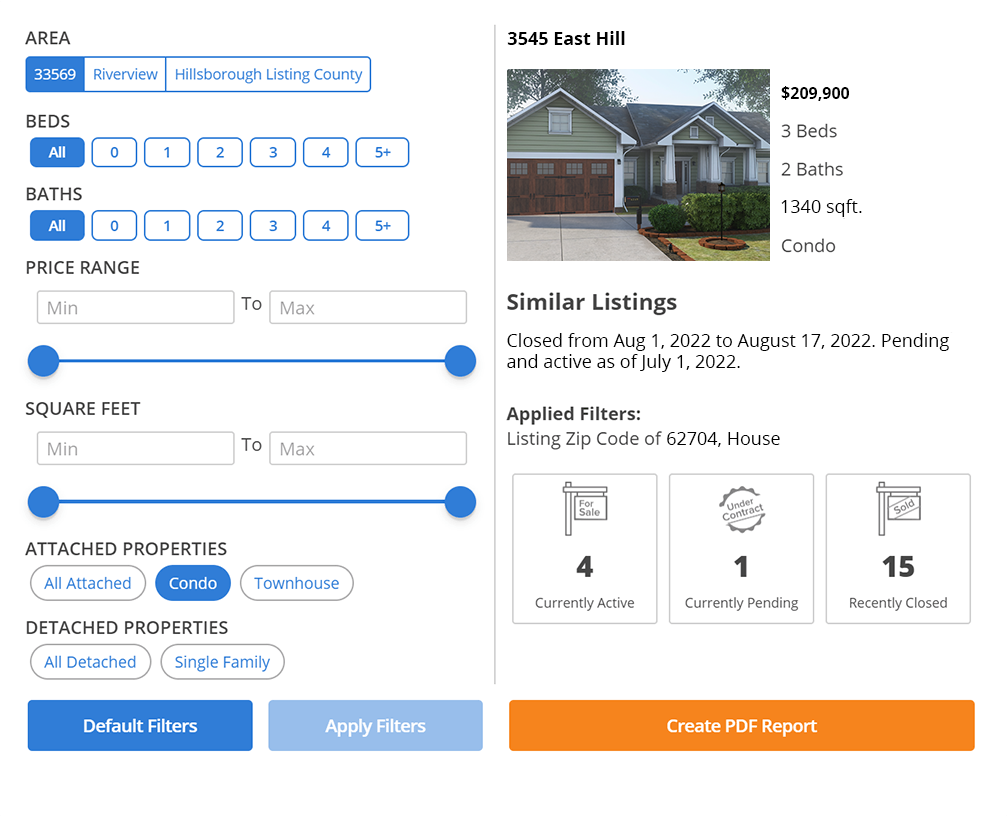
Select your filters.
By default, the filters will be set based on the listing. You can adjust these filters.
Click the image for full size.
Step 5
Select the Apply Filters button.
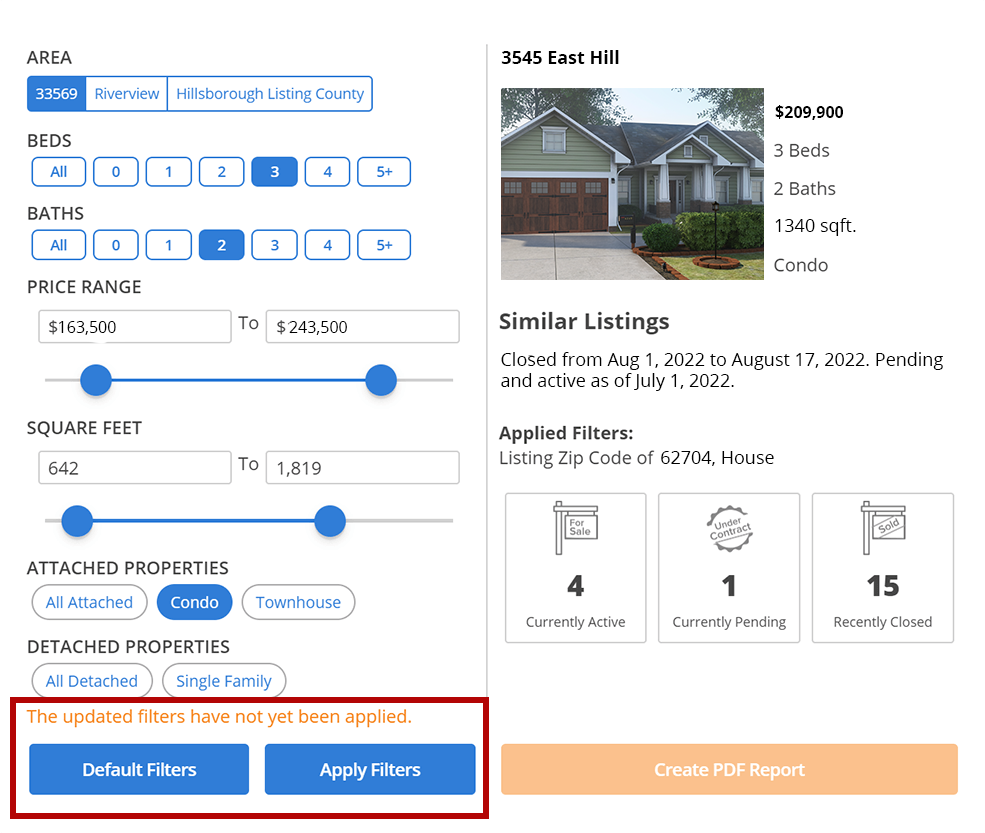
Click the image for full size.
The number of matching comparables will update.
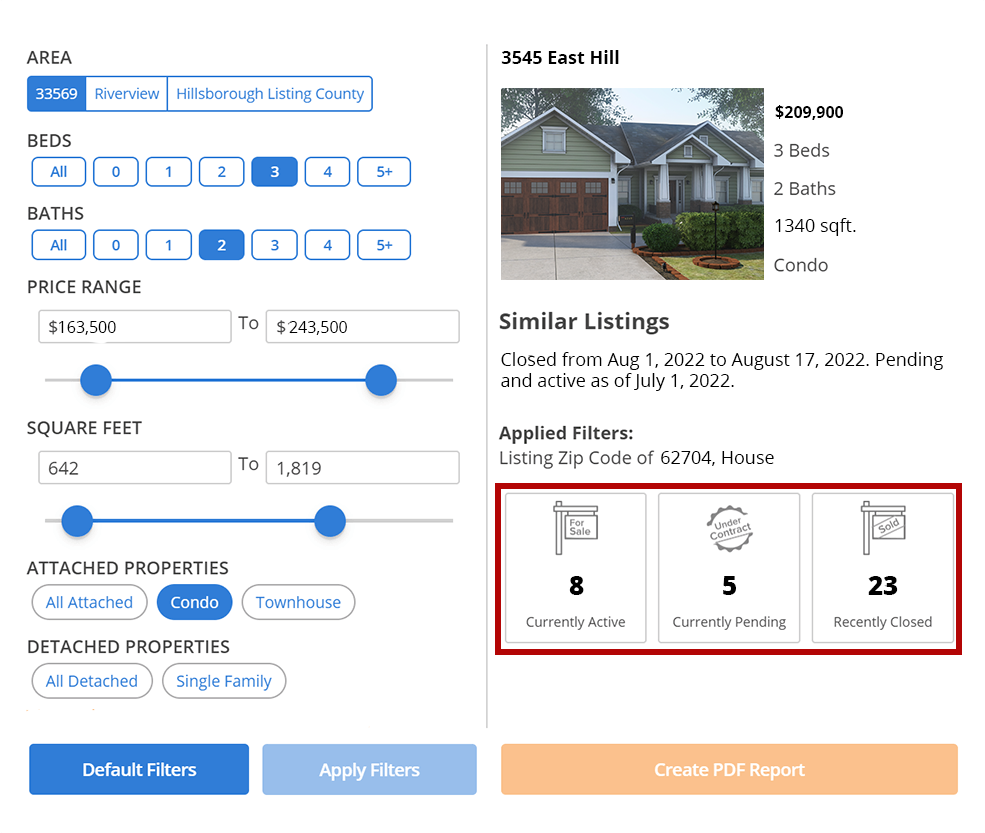
Click the image for full size.

Click the image for full size.
Step 6 (Optional)
Update your filter options to narrow or expand the results. You will be able to see a list of the filter options you have selected.
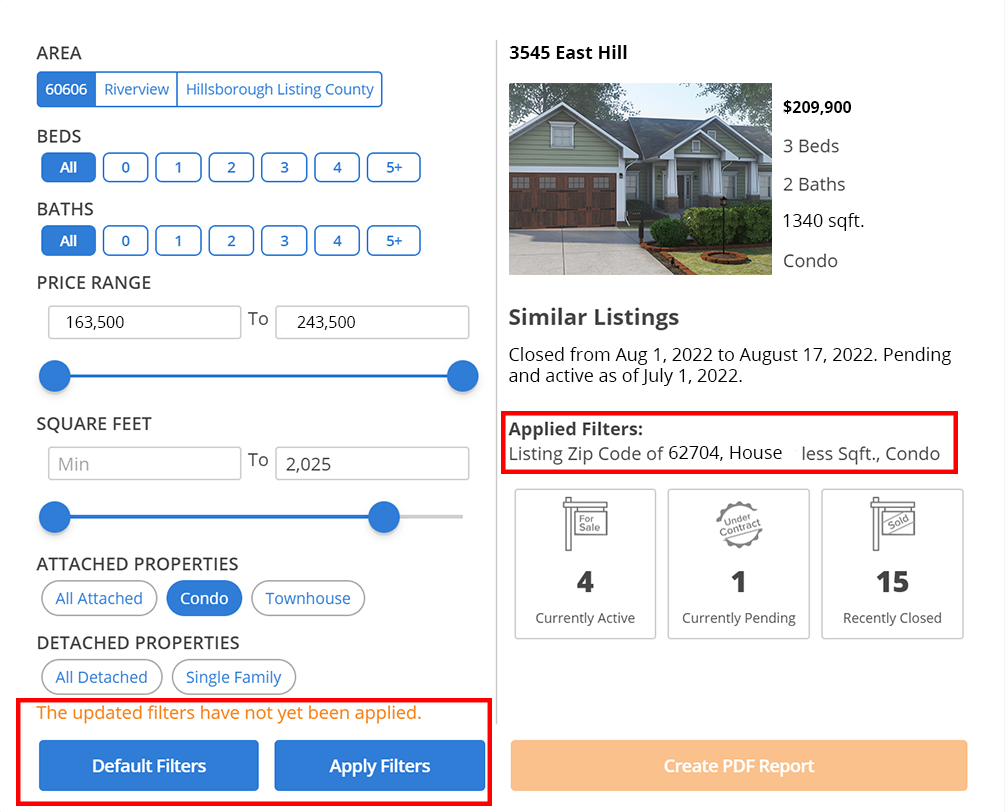
Click the image for full size.
You will need to apply the new filters or you can revert to the default filters.
Step 7
Select Create PDF Report to see the results.
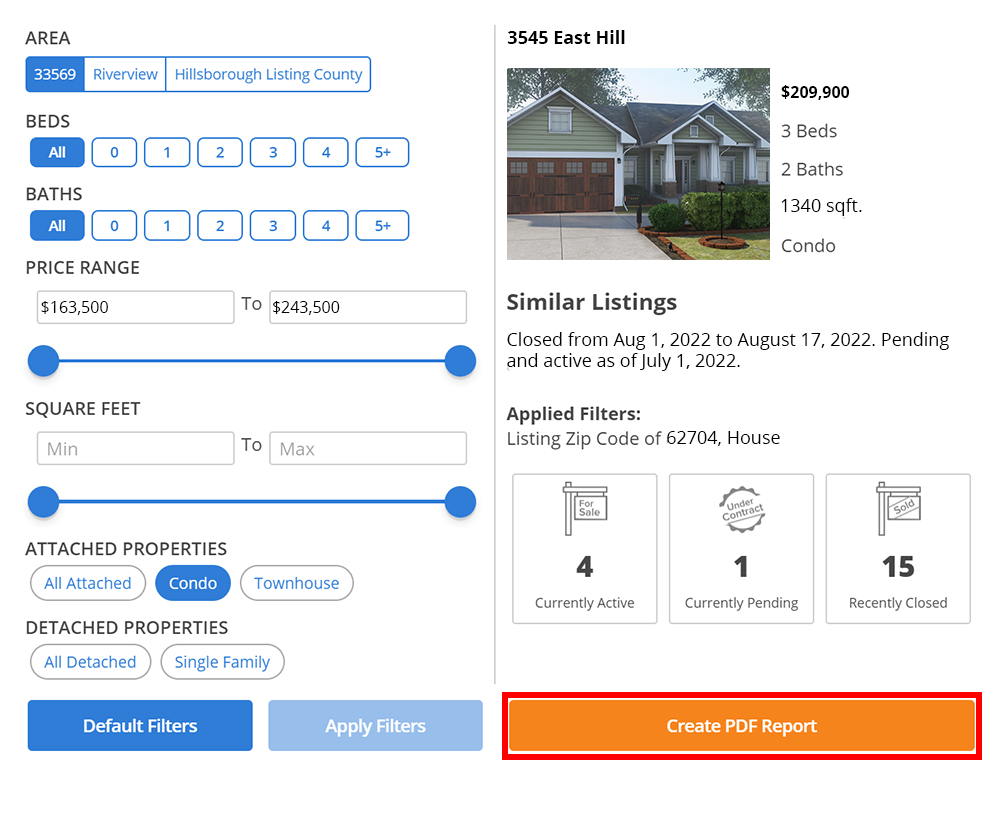
Click the image for full size.
If the Create PDF Report button is not active, you may need to check to see that you have 3 currently active listings or have applied the filters.
You can view a sample report here
The Pricing Benchmark Report allows you to master your market with localized insight into comparable listings. Help your clients make informed pricing decisions by narrowing in on comparables with six filters: location, number of baths, number of beds, price range, square footage, and house type.
Select any image below to see it in full size.

Click the image for full size.
View showing activity on your listing versus comparable listings with the same status (active, pending) then compare days on market for your listing versus comparable sold listings.

Click the image for full size.
Listings priced lower than the median have green circles, between the median and the listing of the report are blue and listings that are priced higher than the median are shaded red.

Click the image for full size.
Quickly review changes sellers are making to their asking prices to make more educated decisions on where to price your listing.

Click the image for full size.
This page calculates the recent absorption rate of properties like your listing and applies that to the amount of inventory currently available.

Click the image for full size.
To update your services please contact support@showingtime.com or check out the Pricing Benchmark Report page on our website to learn more.
How To Run the Pricing Benchmark Report
Step 1
Select Reports from the main menu.

Click the image for full size.
Step 2
Select Pricing Benchmark Report.
Step 3
Select the listing.

Click the image for full size.
You may also run the report from any active or pending listing by clicking the Pricing Benchmark Report button on the listing.
Step 4
Select your filters.
By default, the filters will be set based on the listing. You can adjust these filters.
- Area You will be able to search for properties in the same or similar areas
- Beds You can filter by the number of bathrooms that match the listing.
- Baths You can filter by the number of bedrooms that match the listing.
- Price Range Using the sliders, you can narrow or expand the price range for your search.
- Square Feet Using the sliders, you can narrow or expand the size of the property for your search.
- Attached Properties You can choose to include or exclude the attached properties.
- Detached Properties You can choose to include or exclude detached properties.

Click the image for full size.
Step 5
Select the Apply Filters button.

Click the image for full size.
The number of matching comparables will update.

Click the image for full size.
There will need to be at least 3 currently active listings that match these criteria in the market to run the Pricing Benchmark Report.

Click the image for full size.
Data is updated nightly
Step 6 (Optional)
Update your filter options to narrow or expand the results. You will be able to see a list of the filter options you have selected.

Click the image for full size.
You will need to apply the new filters or you can revert to the default filters.
Step 7
Select Create PDF Report to see the results.

Click the image for full size.
If the Create PDF Report button is not active, you may need to check to see that you have 3 currently active listings or have applied the filters.
You can view a sample report here
What are the Features of the Pricing Benchmark Report?
The Pricing Benchmark Report allows you to master your market with localized insight into comparable listings. Help your clients make informed pricing decisions by narrowing in on comparables with six filters: location, number of baths, number of beds, price range, square footage, and house type.
Select any image below to see it in full size.

Click the image for full size.
View showing activity on your listing versus comparable listings with the same status (active, pending) then compare days on market for your listing versus comparable sold listings.

Click the image for full size.
Listings priced lower than the median have green circles, between the median and the listing of the report are blue and listings that are priced higher than the median are shaded red.

Click the image for full size.
Quickly review changes sellers are making to their asking prices to make more educated decisions on where to price your listing.

Click the image for full size.
This page calculates the recent absorption rate of properties like your listing and applies that to the amount of inventory currently available.
Pricing Benchmark Report FAQ's
- Is it possible to produce the report for a listing that is not an active or pending listing?
- No, the report is designed to support listings you are in the process of selling. Listings that are off-market or sold are not eligible.
- Is the report available for rental listings?
- No, the report is intended to assist in the sale of a property, and cannot be produced for a rental listing.
- Where can I find the Pricing Benchmark Report in ShowingTime?
- To generate the report for any of your active or pending listings, click the Reports tab in ShowingTime and click the “Run Report” link in the Pricing Benchmark Report section.

Click the image for full size.
You may also access the report from any listing worksheet for an active or pending listing by clicking on the Pricing Benchmark Report button.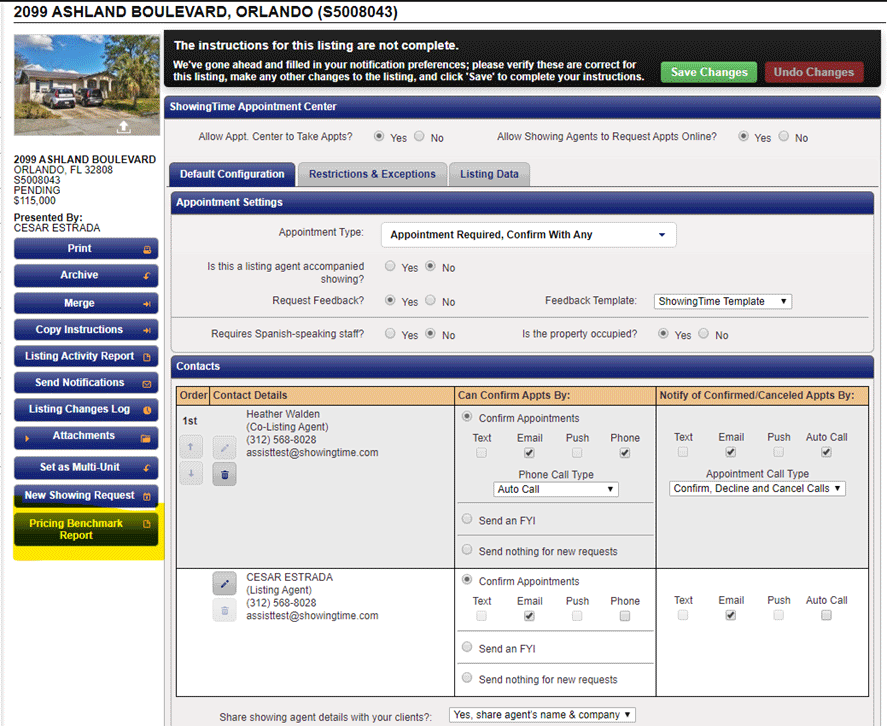
Click the image for full size.
A link to the report can also be found in the appointment confirmation emails that you receive as a buyer's agent.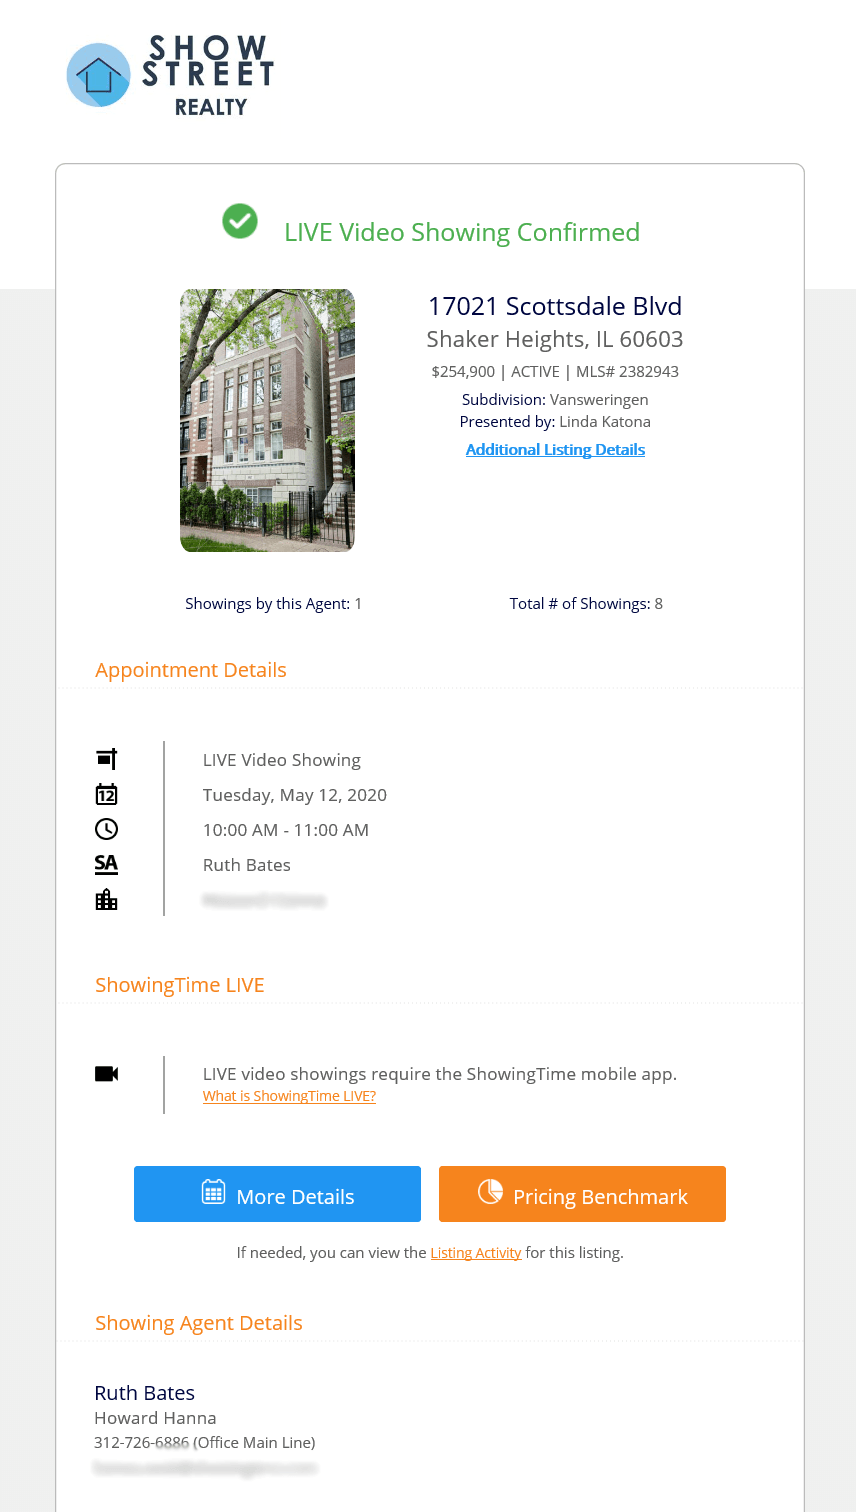
Click the image for full size.
- Is the Report Automatically Emailed?
- Yes. By default, any user subscribed to the Pricing Benchmark Report will receive an email automatically on the 8th, 15th, 22nd, and 29th day of the listing.
- How often is data updated?
- Data is updated nightly.
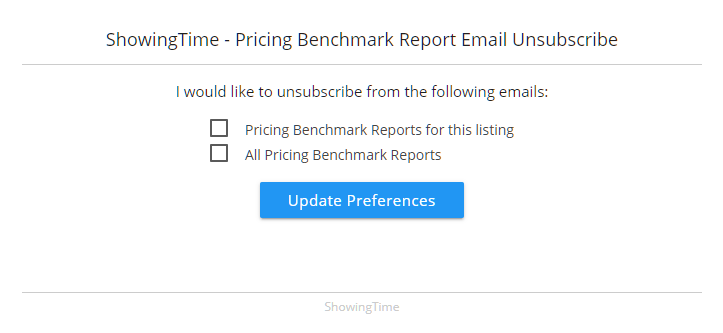
- Can I unsubscribe from the Pricing Benchmark Report?
- Yes. You can unsubscribe from a particular report or all Pricing Benchmark Reports by selecting the unsubscribe link in the email you get.
Click the image for full size.
- Can you Explain the Pricing Benchmark Report metric Absorption Rate?
The Pricing Benchmark Report provides an indicator of how long the current available inventory of homes would take to be absorbed into the market. We call this the Absorption Rate and we calculate it like this:
(Total Homes Sold in Last 12 Months / 12) / # Active Listings = Absorption Rate
In addition, you can think of the Months of Supply like this:
# Active Listings / (Total Homes Sold in last 12 months / 12) = Months of Supply
Here's a sample of Total Sold and # Active Homes and the resulting Absorption Rate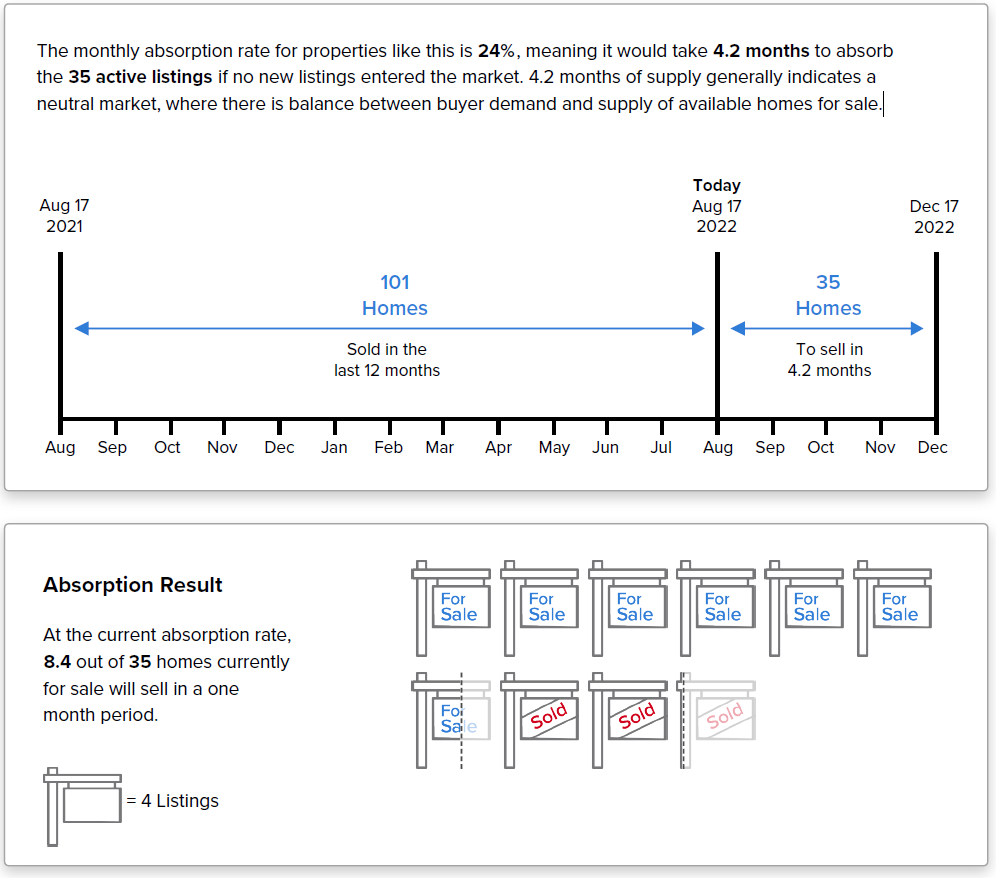
- Why Do I See N/A for Some Values on the Pricing Benchmark Report?
When an NA is shown for a value in a column, it indicates that there is not enough data for that metric.
The image above indicates that while there are listings that were active, there were not at least 3 listings with an active status as of day 14.
Note: Certain settings and features are determined by your office, association, board, or MLS and may not be available in all markets. Information presented in our training materials is a general representation of ShowingTime products.
Please contact support@showingtime.com with any questions on the integration in your market.
Please contact support@showingtime.com with any questions on the integration in your market.


