Target Market Analysis
Overview
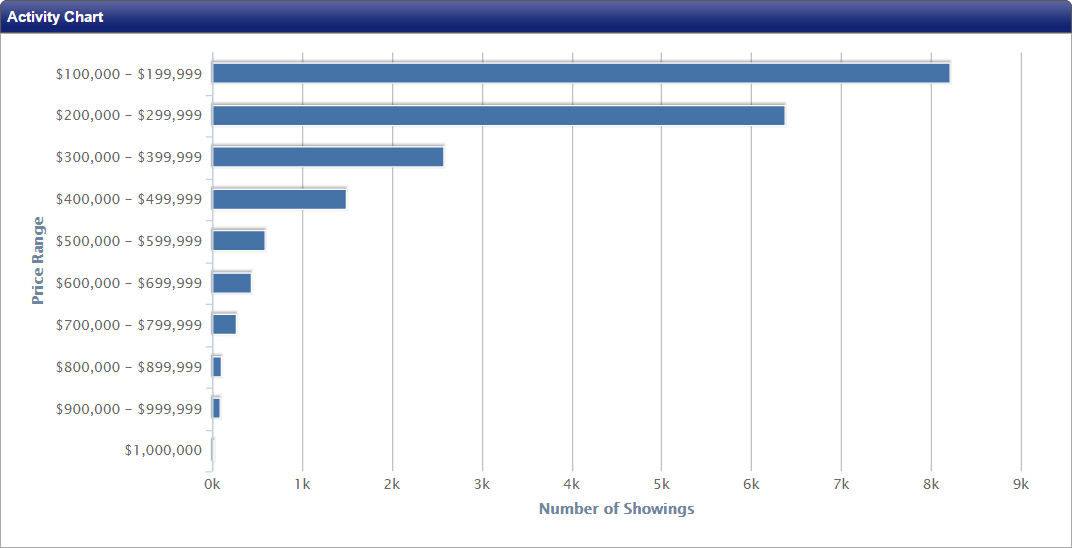
The Target Market Analysis Report provides a graphical and statistical view of which price ranges are producing the most number of showings. You are able to segment properties by listing price increments. This is a perfect report to share with sellers when determining the starting price for a listing or making a price adjustment.
The Target Market Analysis report searches available active inventory. We work with your board to provide complete market-wide data. In some cases, data is not shared with ShowingTime, which can result in limited or no results within a search. NOTE: This report displays statistics about showings in given search criteria; it does NOT display the buyer's agent contact information.
Generating the Report
Step 1
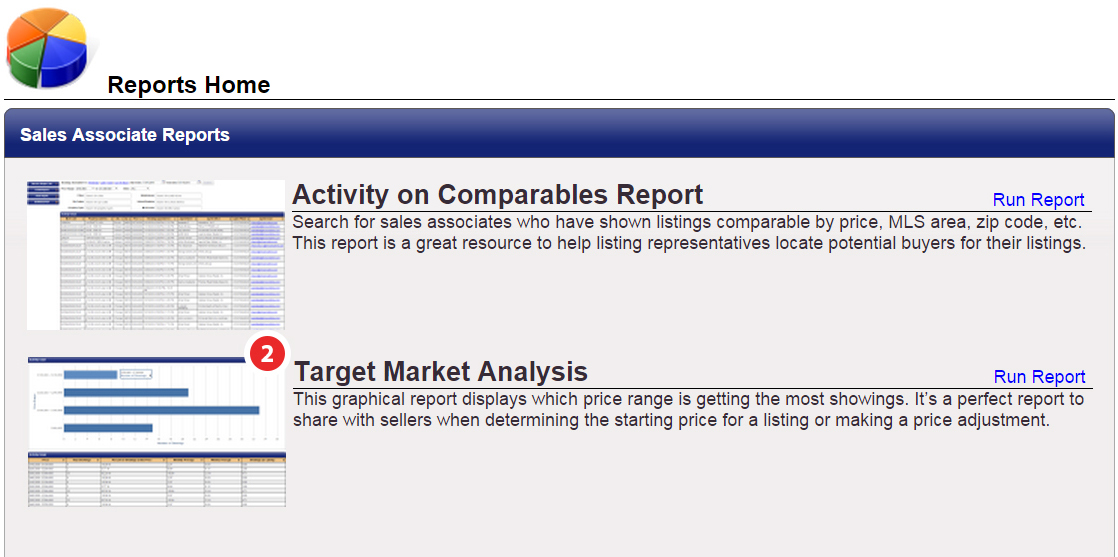
To run the Target Market Analysis Report, start by accessing your Reports tab.
Step 2
Scroll down and click on Target Market Analysis.

Step 3
Select the criteria you would like to use to define your report. You will need to start with a specific duration of time or a date range.
Step 4
Select the price range and increment.
(Optional) **
Choose whether you would like to use Market-wide Data as opposed to Office Data.
(Optional) **
Choose whether you would like to use Market-wide Data as opposed to Office Data.
**Market-wide Data for the Target Market Analysis report is enabled by default in select markets. If the option does not exist on your TMA report, the report will be generated using Office Data from your configured office. For more info, please get in touch with ShowingTime Support.
Step 5 (Optional)
Select any of the data points you would like to refine your search by. You can add multiple selections within each. To remove, select the 'x' next to the data point.

Side Options

Takes you back to the report list.
After you have generated the Target Market Analysis Report you can:
Send it to any recipient that you would like and add a custom subject and message to the attachment.

Print a hard copy.

Download it as a PDF.
An Activity Chart will populate with a visual breakdown of the number of showings per price range increment. Below that are activity details outlining your search criteria, including information on 'Percent of Showings at this Price', monthly and weekly averages, plus 'Showings per Listing'.


